Critical path method CPM
Contents |
[edit] Introduction
Network analysis can help identify the interrelationships between tasks that make up complex processes and establish the most appropriate moment for their execution.
They help in preparing the project programme and determining critical paths. Programmes describe the sequence in which tasks must be carried out so that a project (or part of a project) can be completed on time.
A typical network represents a set of different “arrow diagrams” which go from the origin node to the destination node. In this sense, the path is defined as a sequence of connected events which flow from the start of the project to the end. The time necessary in covering any of these paths is the sum of the time corresponding to each of the tasks involved. The critical path is the one that requires the longest period of time to progress from start to completion and indicates the minimum timeframe necessary to complete the whole project.
The critical path is essentially the route which represents a project's bottleneck. The reduction of the total execution timeframe will only be possible if the activities on this path can be shortened, since the time necessary to execute non-critical activities does not affect the project's total duration. The habit of accelerating all project activities in order to reduce the total timeframe is therefore unnecessary. Decreasing the duration of one or more critical activities, can reduce the project's total timeframe; but it may also change the critical path so that activities which were not previously critical become so.
The CPM or Critical Path Method was developed by Morgan R. Walker of the Engineering Services Division at Du Pont, and James E. Kelley, who worked at Remington Rand. Walker and Kelly were interested in solving the problem of improving scheduling techniques used in the construction of industrial plants; it is based on a deterministic or exact duration of each task.
The associated PERT technique was developed in the Special Projects Office of the US Navy, when Admiral W. F. Raborn recognised that an integrated planning system and reliable control system were necessary in scheduling Polaris ballistic missiles. With his support, a research team was established in 1958 to develop PERT (Program Evaluation Research Task). At the time of the Navy's first internal report on the matter, PERT became the Program Evaluation and Review Technique. D. G. Malcolm, J. H. Roseboom, C. E. Clark and W. Fazar, all from the research team sponsored by the Navy were authors of the first document published on PERT. It is similar to critical path analysis, but the probability of completing by the contract completion date is determined and monitored by way of a quantified risk assessment based on optimistic, pessimistic and most likely activity durations.
[edit] Graphic representation
The graphic representation of a project is called a network and consists of a list of activities and priorities. This visual representation allows each part to be related to the whole, allowing the project to be easily understood. It is important that the priority relationships between the activities involved in the project are clearly identified and represented using partial graphs, which are subsequently used to form a complete network.
A network diagram includes the following steps:
- All the project activities should be clearly defined and identified.
- The technological sequence between the activities must be indicated.
- A network must be constructed which shows the relative priority relationships.
- The execution periods for each activity should be estimated.
- The network is evaluated and the critical path is calculated.
- As time goes on and more information is acquired, it is revised and re-evaluated.
The typical network characterises a set of different “arrow diagrams” which go from the origin node to the destination node. In this sense, the path is defined as a sequence of connected activities, which flow from the start of the project (node 1) to the end. The time required to follow one of these paths is the sum of the times corresponding to each of the activities. The critical path is that which requires the longest time to progress from inception to completion, and indicates the minimum timeframe required to complete the whole project. The diagram below is a graphic representation using the arrow diagram technique. Note that a fictitious activity(F) of no duration had to be entered so that activities F and G do not have the same start and finish node; only in this way is it possible to differentiate both activities and calculate the float for one of them, in particular that of F.
[edit] Calculating the critical path
An algorithm is used to calculate the critical path which includes two phases: forward step and backward step. The forward step starts at the origin node and ends at the destination node. At each node a number is calculated which represents the earliest start time for the corresponding action. These numbers are represented in the figure above in the upper left sector. For the backwards step the calculations are taken from the destination node and flow towards the origin node. The number calculated at each node (shown within the upper right sector) represents the latest finish time for the corresponding activity.
The early start time for each activity is the earliest date on which this activity may begin, assuming that the priority activities have started on their respective earliest start dates. The forward step begins at the origin node, where Dij is the duration of the activity (i,j) and Ei the early start time for all the activities which share origin node i; if i=1, therefore it is the origin node and by convention E1=0 for all critical path calculations. The calculations for this forward step are obtained using the following expression:
If the time necessary to carry out an activity is Dij, the early finish time can similarly be determined as Tij=Ei+Dij.
The last finish Li, is the latest an activity can finish without delaying the project beyond the deadline. In the same way, the last start Iij, is the latest an activity can start without delaying the project's completion date; it is defined as Iij=Lj-Dij.
The second phase, the backwards step, begins at the destination node. Its objective is to calculate the last finish (Li) for all activities which conclude at node i. If i=n, then this is the destination node, Ln=En, and corresponds to the start of the backwards step. In general, for any node i:
Once the two phases are complete, the activities which comprise the critical path can be identified; they are those which satisfy the following conditions:
There are two important types of floats: total and free. The total float, Hij for activity (i,j), is the difference between the maximum time available to carry out the activity (Lj-Ei) and its duration (Dij); it represents the maximum amount of time the start date for the activity can be delayed, in relation to the early start without delaying the completion of the whole project:
Hij = Lj - Ei - Dij = Iij - Ei = Lj - Tij
In terms of the free float, it is assumed that all activities start as early as possible. In this case the free float, Fij for activity (i,j), is the excess of time available (Ej-Ei) over its duration (Dij); it represents the delay allowed for an activity without holding up the early start date for the initiation of another activity. An activity which has a positive total float may also have free float, but this can never be greater than that shown below:
Fij = Ej - Ei - Dij
In the example represented it can be seen that the activities which make up the critical path are A, C, E and G, turning out a project with an 11 month duration. The activities B, D and F have floats, both total and free, of 3, 2, and 1 month respectively.
[edit] Probability applications
Since the end of the fifties network methods have been applied successfully to the scheduling of activities in industry and construction, with reductions of delivery timeframes and costs ranging from 20% to 40%. Nevertheless, one of the inconveniences of the critical path method is its deterministic character. This focus is not appropriate for projects where it is difficult to estimate an exact duration for each activity.
Duration in reality has degrees of probability. For this reason, the original version of the PERT required the use of three different types of estimation about the duration of an activity to obtain basic information about its probability distribution. This information is used to estimate the probability of completing the project on the proposed date. In this case, uncertainty and risk are associated with scheduling through the use of minimum (or optimistic), maximum (or pessimistic) and hopeful (or probable) durations for each task.
This allows the estimation of the probability of fulfilling the project timeframe based on average values and variances in the activities which comprise the critical path. In this way, having determined the optimistic, pessimistic and probable durations for a task, it is possible to estimate its average duration and variances considering a type b distribution function.
Assuming that the number of activities involved in the critical path is sufficiently high, that the duration distribution functions for each task are of the same type and are statistically independent, it is possible to estimate the project timeframe based on the sum of the activity durations which comprise the critical path.
In addition, the variances in the project's duration are evaluated using the sum of the variances in activities which form the critical path, using the Gauss curve distribution function. These conditions are sometimes not fully followed on projects; nonetheless, the PERT technique has offered good practical results.
The three time estimations used by PERT for each activity provide a most probable, optimistic and pessimistic estimation:
- Optimistic time (b): best time expected if the activity's execution goes extremely well.
- Pessimistic time (a): worst time expected if everything goes very badly.
- Most probable time (m): time expected if execution goes normally.
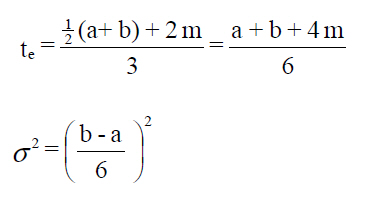
Due to the fact that ”a” (optimistic time) and “b” (pessimistic time) may vary in relation to “m” (most probable time), this distribution may be asymmetrical. As the β distribution was the one that best adjusted to the general properties, it was chosen by the original PERT research team as a model to determine the average expected times "te" and the typical or standard distribution σ, associated with the three time estimations.
Following an analysis which involved a hypothesis on the relationships between the route and typical deviations, and an approximation with regard to the relationship between the average and mode in the β distribution, the following general formulae were proposed for te and σ:
[edit] Conclusion
Current software combines the PERT and CPM techniques. Graphically, the nodes represent the activities and the arrows their interrelationships. These methods allow a more complete understanding than a gantt chart for the different tasks involved in a project. They provide information on the dependency relationships and the decisions to be made to reach the proposed aim.
Fundamentally they provide the following information:
- Tasks to be carried out to reach the objective in the proposed timeframe.
- Activities that determine the project timeframe (critical path).
- Minimum project duration based on the resources available.
- Tasks which require a special effort to reach the established timeframe.
- Current project situation with regard to the completion date.
- Diagram of dynamic activities, which can be modified in line with the data relating to the construction works.
- The effect of the changes made to a schedule on the construction works activities and phases which remain to be carried out.
[edit] Critical delay
A delay to progress of any activity on the critical path will, without acceleration or re-sequencing, cause the overall project duration to be extended, and is therefore referred to as a ‘critical delay’. Ref Society of Construction Law Delay and Disruption Protocol, 2nd edition, February 2017, published by the Society of Construction Law (UK). https://www.scl.org.uk/resources/delay-disruption-protocol
The text in this article was orignially based on an extract from CONSTRUCTION MANAGEMENT, by Eugenio Pellicer, Víctor Yepes, José M.C. Teixeira, Helder Moura and Joaquín Catala. Valencia, Porto, 2008. The original manual is part of the Construction Managers' Library – created within the Leonardo da Vinci (LdV) project No: PL/06/B/F/PP/174014, entitled: “COMMON LEARNING OUTCOME FOR EUROPEAN MANAGERS IN CONSTRUCTION”. It is reproduced here in a modified form with the kind permission of the Chartered Institute of Building.
--CIOB
[edit] Related articles on Designing Buildings Wiki
- Acceleration of construction works.
- Contractor's master programme.
- Design web.
- Earned value.
- Fast-track construction.
- Gantt chart.
- Information release schedules.
- Key performance indicators.
- Lead time.
- Line of balance (LOB).
- Logic links.
- Long lead-time item.
- Milestones.
- Pareto analysis.
- Precedence diagram method.
- Programme consultant.
- Programme float.
- Progress of construction works.
- Project crashing.
- Resource leveling.
- Retrospective longest path analysis.
- Scheduling construction activities.
- Short period programme.
- Time-location chart.
- Wiest-Levy method.
[edit] External references
Featured articles and news
Moisture, fire safety and emerging trends in living walls
How wet is your wall?
Current policy explained and newly published consultation by the UK and Welsh Governments.
British architecture 1919–39. Book review.
Conservation of listed prefabs in Moseley.
Energy industry calls for urgent reform.
Heritage staff wellbeing at work survey.
A five minute introduction.
50th Golden anniversary ECA Edmundson apprentice award
Showcasing the very best electrotechnical and engineering services for half a century.
Welsh government consults on HRBs and reg changes
Seeking feedback on a new regulatory regime and a broad range of issues.
CIOB Client Guide (2nd edition) March 2025
Free download covering statutory dutyholder roles under the Building Safety Act and much more.
AI and automation in 3D modelling and spatial design
Can almost half of design development tasks be automated?
Minister quizzed, as responsibility transfers to MHCLG and BSR publishes new building control guidance.
UK environmental regulations reform 2025
Amid wider new approaches to ensure regulators and regulation support growth.
The maintenance challenge of tenements.
BSRIA Statutory Compliance Inspection Checklist
BG80/2025 now significantly updated to include requirements related to important changes in legislation.
Shortlist for the 2025 Roofscape Design Awards
Talent and innovation showcase announcement from the trussed rafter industry.


