


Time-location chart
A time-location chart is a graphical representation of a construction program against axes of time and location (distance). It is a communication tool for project management that is used to inform a team about what needs to be done and when, as clearly and efficiently as possible.
Most construction planning and scheduling is carried out using bar charts, also known as Gantt charts. These charts plot activities against time, making them useful for knowing what to do at a specific time, however, they do not show where the work is being carried out. For civil engineering projects such as pipelines, railways, tunnels and roads, or repetitive projects such as housebuilding or high-rise building, it can be beneficial to chart activities against time and location.
A Gantt chart plots time on the horizontal axis and activities on the vertical axis. In contrast, a time-location chart is much less fixed. Location (distance) is often plotted on the horizontal axis and time on the vertical, although it varies as to whether it runs from the earliest down to the latest date or vice versa. Typically, charts for road and tunnel projects start at the top and progress downwards; whereas projects for buildings and pipelines start at the bottom and progress upwards.
Activities are shown as a line or shape (boxes or symbols) in the main body of the chart, making it possible to view the activities that will be taking place in which location at any particular time. The geometrical shapes show the occupation of the site over time, and ensure that conflicting access can be detected visually. Different types of activity are identified by specific colours, fill patterns, line types or special symbols. A key is used to clarify what the different symbols represent.
The advantage of a time-location chart is that it illustrates all visible activities along a construction site on a single chart. However, care must be taken not to include too much detail, as clarity can be lost in place of complexity, moving away from the purpose of the chart which is to make the construction programme easily understandable.
[edit] Related articles on Designing Buildings Wiki
- Activity schedule.
- Construction management.
- Contractor’s master programme.
- Critical path method.
- Design web.
- Gantt chart.
- Key performance indicators.
- Line of balance (LOB).
- Milestones.
- Pareto analysis.
- Programme float.
- Programme for building design and construction.
- Project programme.
- Resource management.
- Scheduling construction activities.
- Time management of construction projects.
Featured articles and news
Costs and insolvencies mount for SMEs, despite growth

Construction sector under insolvency and wage bill pressure in part linked to National Insurance, says report.
The place for vitrified clay pipes in modern infrastructure

Why vitrified clay pipes are reclaiming their role in built projects.

Research by construction PR consultancy LMC published.
Roles and responsibilities of domestic clients

ACA Safety in Construction guide for domestic clients.
Fire door compliance in UK commercial buildings
![]()
Architect and manufacturer gives their low down.
Plumbing and heating for sustainability in new properties

Technical Engineer runs through changes in regulations, innovations in materials, and product systems.
Awareness of the Carbon Border Adjustment Mechanism
What CBAM is and what to do about it.
The new towns and strategic environmental assessments
12 locations of the New Towns Taskforce reduced to 7 within the new towns draft programme and open consultation.

Buildings that changed the future of architecture. Book review.
The Sustainability Pathfinder© Handbook
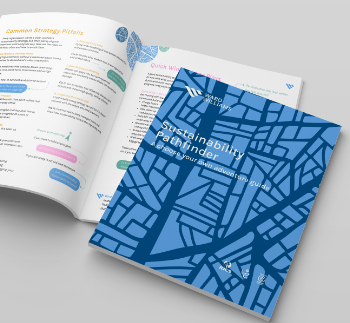
Built environment agency launches free Pathfinder© tool to help businesses progress sustainability strategies.

Government outcome to the late payment consultation, ECA reacts.
IHBC 2025 Gus Astley Student Award winners
![]()
Work on the role of hewing in UK historic conservation a win for Jack Parker of Oxford Brookes University.
Future Homes Building Standards and plug-in solar

Parts F and L amendments, the availability of solar panels and industry responses.
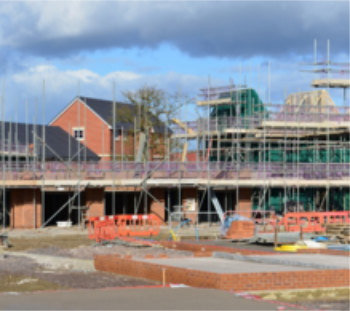
How later living housing can help solve the housing crisis

Unlocking homes, unlocking lives.
Preparing safety case reports for HRBs under the BSA

A new practical guide to preparing structural inputs for safety cases and safety case reports published by IStructE.
Male construction workers and prostate cancer

CIOB and Prostate Cancer UK encourage awareness of prostate cancer risks, and what to do about it.