


Gantt chart
The timeline bar chart, Gantt diagram or Gantt chart was conceived by the American engineer Henry L. Gantt between 1903 and 1917. The basic technique is quite simple, consisting of a graphic representation based around two axes: the vertical axis features tasks and the horizontal axis shows time.
Gantt attempted to solve the activity scheduling problem so that the duration of a basic task was seen on a horizontal bar,showing its start and completion date, and in the same way the total time required in executing an activity. It is the most widespread scheduling method as it adapts well to both small and large projects of all types, assuming they are not overly complex. It is the most commonly used method of scheduling works in the construction industry and can be easily understood, even by those less familiar with scheduling tools.
The preparation of the chart may include a range of basic data spread over columns:
- Activities, according to the order in which they are carried out.
- Budget or cost.
- Quantity in its corresponding units.
- Predicted performance for working equipment.
- Duration of the activity.
The time unit used may be days (short projects), weeks (medium term projects) or months (long-term projects). The beginning and end of each horizontal bar represents the start and completion date for the corresponding task and so the length of the bar is therefore proportional to the duration. The last two rows of the chart may detail the cost or budget per unit of time in addition to that accumulated since the project began.
The figure below shows a simplified Gantt diagram, indicating the tasks and their monthly distribution for the first break-down level as well as the tasks which comprise the critical path and the float.

Gantt charts can be very effective in the initial planning stages, but the graphics can become confusing when changes are made and they have serious limitations for complex projects. It was these difficulties which gave rise to the development of more complex network diagrams.
The text in this article is based on an extract from CONSTRUCTION MANAGEMENT, by Eugenio Pellicer, Víctor Yepes, José M.C. Teixeira, Helder Moura and Joaquín Catala. Valencia, Porto, 2008. The original manual is part of the Construction Managers’ Library – created within the Leonardo da Vinci (LdV) project No: PL/06/B/F/PP/174014, entitled: “COMMON LEARNING OUTCOME FOR EUROPEAN MANAGERS IN CONSTRUCTION”. It is reproduced here in a modified form with the kind permission of the Chartered Institute of Building
--CIOB
[edit] Related articles on Designing Buildings Wiki
- Acceleration.
- Activity schedule.
- Construction project management software.
- Contract programme.
- Contractor's master programme.
- Critical path method.
- Design web.
- Earned value.
- Information release schedules.
- Key performance indicators.
- Line of balance (LOB).
- Milestones.
- Pareto analysis.
- Precedence diagram method.
- Programme float.
- Programme consultant.
- Project crashing.
- Time-location chart.
- Time management of construction projects.
- Work breakdown structure.
[edit] External references
Featured articles and news
Costs and insolvencies mount for SMEs, despite growth

Construction sector under insolvency and wage bill pressure in part linked to National Insurance, says report.
The place for vitrified clay pipes in modern infrastructure
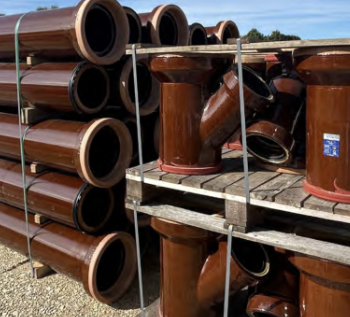
Why vitrified clay pipes are reclaiming their role in built projects.

Research by construction PR consultancy LMC published.
Roles and responsibilities of domestic clients

ACA Safety in Construction guide for domestic clients.
Fire door compliance in UK commercial buildings
![]()
Architect and manufacturer gives their low down.
Plumbing and heating for sustainability in new properties

Technical Engineer runs through changes in regulations, innovations in materials, and product systems.
Awareness of the Carbon Border Adjustment Mechanism
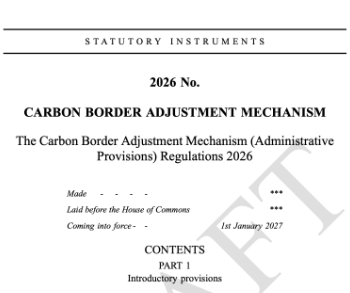
What CBAM is and what to do about it.
The new towns and strategic environmental assessments
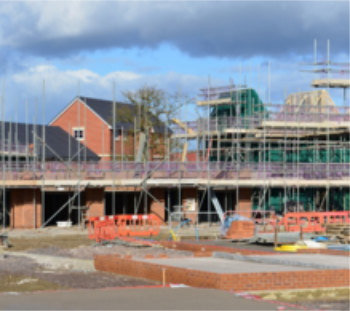
12 locations of the New Towns Taskforce reduced to 7 within the new towns draft programme and open consultation.
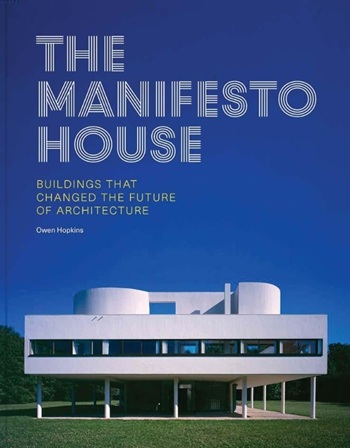
Buildings that changed the future of architecture. Book review.
The Sustainability Pathfinder© Handbook
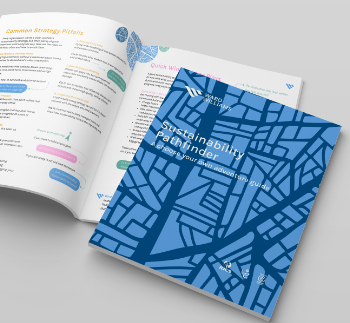
Built environment agency launches free Pathfinder© tool to help businesses progress sustainability strategies.

Government outcome to the late payment consultation, ECA reacts.
IHBC 2025 Gus Astley Student Award winners
![]()
Work on the role of hewing in UK historic conservation a win for Jack Parker of Oxford Brookes University.
Future Homes Building Standards and plug-in solar
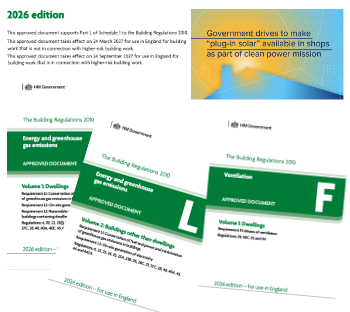
Parts F and L amendments, the availability of solar panels and industry responses.
How later living housing can help solve the housing crisis

Unlocking homes, unlocking lives.
Preparing safety case reports for HRBs under the BSA

A new practical guide to preparing structural inputs for safety cases and safety case reports published by IStructE.
Male construction workers and prostate cancer

CIOB and Prostate Cancer UK encourage awareness of prostate cancer risks, and what to do about it.