Value Stream Mapping in the Construction Industry
Contents |
[edit] An Introduction to Value Steam Mapping (VSM)
VSM is one of the components of Lean Manufacturing. Elizar et al. [3] define Value Stream Mapping (VSM) as “a method of business process improvement”. Other authors - Womack, Jones, Ross (Athuraliya) [1] - consider it a “set of specific actions required to bring a specific product through the three critical management tasks of any business…the problem-solving task…information management task…physical information task”. The technique aims to analyse a process via its visualization in graphical mode to eliminate waste and increase the value delivered by the process. In other words, it can be used to improve a process, increase efficiency and reduce waste by describing a production process – either for a product or service – by an advanced graphical representation and focusing on the value that each step within the process really has.
As per other methodologies, also VSM was started at Toyota factories. Athuraliya (2020) [1] stated that the terminology was first used by J.P. Womack and D.T. Jones in their book “The Machine that Changed the World”, Simon & Schuster, 1990.
Before describing the methodology in detail, a brief explanation of the terms that are essential to the VSM (and in Lean Six Sigma in general):
- Current State – the state of the process we want to improve. How it actually looks like at present.
- Future State – the target state of the process.
- Value Add Activity (VA) – an activity that increases the value of the product or service from the customer point of view. It advances an input of the process toward the result expected by the client; either the client values the result or is ready to pay for it.
- Non-Value Add Activity (NVA) – it includes anything that is not necessary, either because it doesn’t add value from the customer point of view or because serves no purpose for the business, or is undertaken as a result of failure to get something right first time or failure to do in the first place.
- Business Non-Value Add Activity (BNVA) – a step that cannot be removed as it is necessary for producing value add activities but produces no return for the customer. Essentially, what is needed by the organisation.
- Work In Progress levels (WIPs) – the number of products, parts or services being processed within a step or within the end-to-end process.
- Total Lead Time – “the time for a product or service to pass through the whole process from start to finish” (OpexResources); that includes delays. As an example, pouring concrete can be analysed from the moment the concrete arrives at the site until it reaches the required strength and the final item is accepted.
- Takt time – Takt time is the average time required to produce one unit of customer demand. It is the regular rate at which the process needs to deliver good output to the customer.
A concept that is also basic in the Lean methodology is the definition of “waste”. In simple words, “waste is anything that creates no value for the parties involved in the process namely owner, customer, and consumer.” (Vilasini & Gamage, 2010) [8]. It is critical to remember that “waste” or “muda” in Japanese, is not only what is thrown away after production. Muda is a Japanese word that means having no material or work activity that does not contribute positively to the successful completion of the works (it actually means “no horse”, the implication being that you do not need a horse to carry something that you can carry yourself). There are seven different types of “muda”:
| Waste | Definition | Example |
| Overproduction | Producing more than what’s needed by the Client or the next step in the process. | The volume of in situ concrete required is miscalculated and more delivered to site than required. This can then lead to wasting the excess concrete at the end of pour. |
| Waiting | Delaying between processes or steps. | Work being delayed due to broken equipment, bad weather. |
| Transportation | Unnecessary movement of materials, people, products or information. | Materials have to be moved from one storage area to another storage area to accommodate site works. |
| Extra Processing | Adding or doing more than customers want. | Performing too many reviews. |
| Inventory | The work in progress is in excess of what the customer needs. | Materials are delivered too far in advance of the installation works requiring space to be allocated for storage. |
| Motion | Needless movements by people. | The poor material layout will produce unnecessary movements by workers on the worksite. |
| Defects | Aspects of outputs not conforming to customer needs. | Defective materials and damaged equipment can lead to rework and increase costs. |
Table 1 – Elaboration of “Seven Wastes” (Li and Solís, 2018) & #8 Wastes” (PMI)
Some additional types of waste are also proposed by others (OpexResources):
| Waste | Example |
| Wasted human potential | The loss of skills and expertise as a consequence of a strict hierarchical culture. We can also be using highly competent staff to undertake tasks requiring less or different skills. |
| Wasted energy | This relates to the environmental /sustainability concerns as well as having cost implications. |
| Pollution | This is important not only because of the production process, but also economically when pollution results in additional taxes or fines. |
| Wasted space | It is self-explanatory and even more important in the construction industry where sites are often confined to a restricted footprint due to location constraints. |
Table 2 - Additional Type of Waste
From the point of view of providing Services, some more types of waste are proposed.
| Waste | Example |
| Delay in provision | A delay can cause waiting time for the next step in a process or can even make the service useless to the client. For example, delays to design can have a knock on effect delaying construction works. |
| Incorrect inventory | Incorporating incorrect inventory at any point in the process can result in non-conforming product. This may not be noticed until the end of construction if the appropriate checks are not used. |
| Duplication | This can occur in information management processes with duplicated or unnecessary exchange of data. |
Table 3 - Additional Types of Waste in Service
Even though the classification is relatively easy to understand, it is not always easy to spot the “Muda” in all its components. This should not discourage those who start their journey in Lean methodologies for the first time; as any improvement process, time and experience support refining the results. An easy way to remember the main Muda is offered in the acronym “DOWNTIME” (PMI).
| D | Defects |
| O | Overproduction |
| W | Waiting |
| N | Non-Utilised Talents |
| T | Transport |
| I | Inventory |
| M | Motion |
| E | Excessive Processing |
Table 4 - Muda as "D.O.W.N.T.I.M.E."
The application of the VSM is not the responsibility of an individual; it is a team effort. Usually, the team should be of maximum of 10 people, chosen among those with longer experience and directly involved in the process. These prerequisites satisfy two conditions:
- Avoiding overcrowded teams that may not work in an efficient way
- Be more effective by relying on the experience and knowledge of those who work in the process the process better than others.
It is good practice to invite a supplier and/or a client representative at least to one meeting to discuss the VSM initiative; their input could also be invaluable.
VSM was developed in and for the manufacturing industry. The first studies to apply Lean Manufacturing to construction go back to 1992 by Koskela (Picchi & Granja, 2004) [5]. VSM’s advantages in construction have been proved over the years – Elizar et al. [3] conducted a study on 383 respondents in Indonesia, showing that VSM can be a valid technique for the Industry.
[edit] How to Use VSM
Using VSM involves various steps. For simplicity, the main ones are the following:
- Collecting Data, defining the area of the organisation under consideration, including everything that contributes or is involved in the production; people, machinery, materials and observing how the process operates.
- Map out the process to show the Current State (i.e. the current working practices)
- Map out the process to show the Future State (desired flow).
- Planning and implementing the necessary Changes to arrive at the Future State.
“Maps” are intended as a graphical representation of how the processes work, as shown later in Figure 1, 2, and 3.
[edit] Preparation – Data Collection
The initial focus should be on activities that need to be repeated during a reasonable period – like rebar – or that are repeated at intervals - like concrete pouring – so that the improvement process is allocated enough time to produce its benefits.
It is important that not too many people are involved in defining the VSM as ‘too many cooks’ could result in a delay in arriving at a solution; as above, a maximum of ten is suggested.
The objective is to observe the process, determine the sequence of activities, the time spent for each of them and record the task time - for example, how long it takes to place the concrete, but how long the lorry was waiting, how long it took to slump and how long after that the pour was made and so on. The observations and recordings must be made at a detailed level, so that the time for each activity can be reduced as far as possible. It is important to determine staffing levels, such as numbers of people involved in each operation.
[edit] Mapping the Current Process
The current process must form the basis of the VSM. It helps the organisation to see the flow of the value from one end of the process to the other.
There are symbols in use in the map, to identify consistently the elements in exam. However, once the methodology is clear, the use of standard symbols is not mandatory. The organisation can decide to populate the process summary in the way that better fits the purpose or that more easily is understood by participants.
[edit] Mapping for the Future State (desired)
This step shall follow the same rules that were defined for the previous one. Same symbols; same approach in calculating timing. The new mapped process should represent the new settings, as a consequence of the improvements. Such improvements should provide an indication of the expected measurements of how a step would be if modified as proposed. As an example: opening a new gate to the site would cut the waiting time for “X” minutes…. would reduce the pouring time for “X” minutes…would increase the process efficiency by “X” percentage.
[edit] Planning and implementing the necessary Changes
The implementation is when the study is put into practice. At any time, if the implementation appears too complicated or expensive – in summary, if it moves away from the estimations done in the previous phase – it is advisable to stop it and go back to the study. Some variables could have been missing or new inputs may need to be considered .
[edit] A Practical Application of VSM to the Construction Industry
Desai and Shelat (2014) [2] propose a case study based on the main operations involved in the Reinforced Concrete Cast (RCC) and how to improve the production by optimising the process which demonstrates VSM in practice.
The Preparation – Data Collection leads to the table below, where the main information for each step is organised in terms of:
- Type of activity
- Quantity to be produced
- Human Resources involved
- Duration of each activity
| Activity | Quantity | Rescource Required: Carpenter | Rescource Required: Fitter | Rescource Required: Helper |
Rescource Required: Mason + MC |
Rescource Required: Total | Day |
|
Starters fixing & |
17 nos. | 3 | 2 | 1 | - | 6 | 2 |
|
fixing & |
17 nos. | 4 | 3 | 2 | - | 9 | 4 |
|
bottom & slab |
265 SQM T. |
11 | - | 9 | 2 | 22 | 4 |
| 5.5 T | - | 19 | 4 | - | 23 | 4 | |
| Concreting |
265 SQM T. |
4 | 1 | 8 | 19 | 32 | 1 |
| Total Days | 15 |
Table 5 - Preparation - Data Collection
For the purpose of this article, it is not essential that the data, based on experience in India, matches the production in other countries. It is an example useful to understand the power of VSM.
The analysis is then converted into a graphic, as shown below, the Current State.
Figure 1 - Current State for RCC
Colour coding is as follows:
- Blue – preparation activities
- Green – main activities
- Red – post-activities
The arrows represent the direction of the flow/production of goods/services.
The graphic is organised according to a timeline that moves from left to right; activity on the left comes before the one on the right.
For each activity, the time requested is shown. Usually, the time to pass from an activity to another would be represented at the bottom of the page. The time considered necessary (i.e., Value Add Activity) would be shown at the lower position; the time that is considered a waste of any type would be shown in the upper position. The example below is typical for a manufacturing environment.
Figure 2 - Timeline showing VA and NVA
For simplicity, this article does not use the above graphic.
The triangles represent the need for inventory in order for the activity to progress without interruptions.
Information reported below or on the side of cells is the most relevant data for the specific activity; the number of days required to perform the activity, number of workers involved (labour), the quantity of material (square meters to be completed or tonnes of steel to be worked).
From placing the order to the arrival of material on site – all the blue cells on the left – it takes 11 days, involving not less than 7 persons plus the drivers, who are not considered for the purpose of this improvement exercise. The mere purchase of steel requires 7 days advance delivery to be able to complete cutting/bending operation on time.
On the right, we have the supply of concrete, whose purchase order is placed two days before concreting.
Finally, curing completes the entire process.
In this setting, the steel needs to be kept on site, so requiring an adequate storage area, working area, surveillance at night/weekends, and production waste coming from the cutting phase (hence, waste disposal management and additional costs). Furthermore, the use of personnel on site that could otherwise be used for other activities. Each organisation may do their own calculation to estimate how much this scenario would cost to them….
Various improvements can be proposed, some in line with the purpose of the analysis and some discovered incidentally. Remaining on what is in line with the initial scope:
< >Each column can be fixed off-site and erected on site by using a craneOff-site column fixing can be started two days earlier using a safety stock of steelThe risk of working on heights can be avoidedThe slab can be completed within 13 days, instead of 15. The saving is higher than 13%.
Figure 3 - Future State for RCC
A critical point: the modifications themselves have a cost to be accounted for; time, money, workers, means (in our case, the cost of renting a crane). The steps from the Current State should be compared with the new ones for the Future State, and the balance carefully evaluated.
When considered for a multistorey building, the case study offers undoubtful advantages, as reducing time has an immediate effect in terms of:
[edit] Conclusion
VSM is a powerful tool, which merges detailed analysis with a simplified graphical representation.
Regardless of its origins, rooted in the manufacturing industry, VSM finds application in different phases of a project and in a variety of sectors such as logistics, supply chain, service industries, healthcare, software development, product development, and office processes. As written above, all of these sectors are characterised to a certain extent by work processes that tend to be repetitive and subject to a low level of variability. Construction work is characterised by having many tasks, most of which happen only once. However, there are some activities, such a placing concrete that are repetitive and can benefit from this type of analysis.
It should also be noted a simplified version of VSM is proposed above. The intent was to give a clear picture of the approach, more than the technicalities entailed by its use. The approach also ensures a quicker application of the tool, matching the time constraints that market operators usually have.
With a bit of experience, the user can master the methodology described above and may even choose to further expand the techniques used .
[edit] References
[1] Athuraliya, A. (2020). Value Stream Mapping Guide | Complete VSM Tutorial. https://creately.com/blog/diagrams/value-stream-mapping-guide/
[2] Desai, A.E and Shelat, M.J (2014). Value Stream Mapping as a Lean Construction Tool – a Case Study. International Journal of Engineering Research & Technology (IJERT) IJERTIJERT ISSN: 2278-0181 IJERTV3IS120412 www.ijert.org (This work is licensed under a Creative Commons Attribution 4.0 International License.) Vol. 3 Issue 12, December-2014
[3] Elizar et al (2017). Elizar, Suripin and Mochamad Agung Wibowo. The concept of value stream mapping to reduce of work-time waste as applied the smart construction management. AIP Conference Proceedings 1903, 070010 (2017); https://doi.org/10.1063/1.5011579 Published Online: 14 November 2017
[4] Li, Y. and Solís, J.L. (2018). A Structured Literature Review: Value Stream Mapping (VSM) In Construction Industry. Available electronically from https://hdl .handle .net /1969 .1 /166266.
[5] Picchi, F. and Granja, A.D. (2004). Construction sites: using lean principles to seek broader implementations. https://www.researchgate.net/publication/283726623
[6] PMI (2021). 8 wastes (2021). Process Management International. https://pmi.co.uk/knowledge-hub/our-improvement-toolbox-8-wastes-2/
[7] Sudhakar, N. and Vishnuvardhan, K. (2017). Improving Productivity in Construction by using Value Stream Mapping. International Journal of Engineering Technology Science and Research. IJETSR www.ijetsr.com ISSN 2394 – 3386 Volume 4, Issue 2 February 2017
[8] Vilasini, N. and Gamage, J.R. (2010). Implementing Value Stream Mapping Tool in the Construction Industry. International Research Conference on Sustainability in Built Environment. ResearchGate.
Original article written by Giorgio Mannelli & reviewed by Susannah Clarke on behalf of the Construction Special Interest (ConSIG) Comptency Working Group (CWG). Article peer reviewed by the CWG and accepted for publication by the ConSIG Steering Committee 26/1/2022.
--ConSIG CWG 19:08, 30 Jan 2022 (BST)
[edit] Related articles on Designing Buildings
Featured articles and news
ECA Blueprint for Electrification
The 'mosaic of interconnected challenges' and how to deliver the UK’s Transition to Clean Power.
Grenfell Tower Principal Contractor Award notice
Tower repair and maintenance contractor announced as demolition contractor.
Passivhaus social homes benefit from heat pump service
Sixteen new homes designed and built to achieve Passivhaus constructed in Dumfries & Galloway.
CABE Publishes Results of 2025 Building Control Survey
Concern over lack of understanding of how roles have changed since the introduction of the BSA 2022.
British Architectural Sculpture 1851-1951
A rich heritage of decorative and figurative sculpture. Book review.
A programme to tackle the lack of diversity.
Independent Building Control review panel
Five members of the newly established, Grenfell Tower Inquiry recommended, panel appointed.
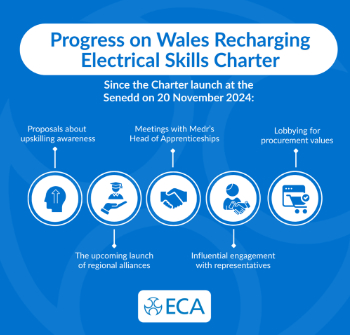
Welsh Recharging Electrical Skills Charter progresses
ECA progressing on the ‘asks’ of the Recharging Electrical Skills Charter at the Senedd in Wales.
A brief history from 1890s to 2020s.
CIOB and CORBON combine forces
To elevate professional standards in Nigeria’s construction industry.
Amendment to the GB Energy Bill welcomed by ECA
Move prevents nationally-owned energy company from investing in solar panels produced by modern slavery.
Gregor Harvie argues that AI is state-sanctioned theft of IP.
Heat pumps, vehicle chargers and heating appliances must be sold with smart functionality.
Experimental AI housing target help for councils
Experimental AI could help councils meet housing targets by digitising records.
New-style degrees set for reformed ARB accreditation
Following the ARB Tomorrow's Architects competency outcomes for Architects.
BSRIA Occupant Wellbeing survey BOW
Occupant satisfaction and wellbeing tool inc. physical environment, indoor facilities, functionality and accessibility.


