


Psychrometric charts

BG 87/2024, Useful Information Guide, written by Chin Hang “Kay” Lam and published by BSRIA in 2024, defines Psychrometrics as: ‘The study of the properties of moist air, including properties such as relative humidity, dry bulb temperature and wet bulb temperature.’
Psychrometric charts are complex graphs that can be used to assess the physical and thermodynamic properties of gas-vapour mixtures at a constant pressure. They are often used to assess the properties of moist air. This can be useful in the design of heating, ventilation and air-conditioning systems for buildings, and psychrometric charts often include a zone in the middle that represents the range of conditions that people find comfortable under different circumstances (such as summer and winter).
Typically, the properties represented on psychrometric charts are:
- Dry-bulb temperature: A measure of air temperature recorded by a thermometer exposed to the air but shielded from radiation and moisture.
- Wet-bulb temperature: The temperature recorder by a thermometer that has its bulb wrapped in cloth and moistened with distilled water. The rate of evaporation from the wet bulb, and so the temperature it records varies depending on the humidity of the air it is exposed to.
- Relative humidity: The ratio of the actual vapour pressure relative to the vapour pressure of saturated air at the same temperature, expressed as a percentage.
- Specific volume: The volume of a unit weight of dry air.
- Dew point temperature: The highest temperature at which water vapour will condense.
- Humidity ratio: The dry-basis moisture content of air expressed as the weight of water vapour per unit weight of dry air.
- Enthalpy: The energy content of air.
The state of moist air can be determined from any two of these properties, from which all other properties can then be determined.
Atmospheric pressure varies with altitude and so a number of psychrometric charts are available for different atmospheric pressures, however, for altitudes of less than 600m the sea-level psychrometric chart is often considered adequate.
[edit] Related articles on Designing Buildings
Featured articles and news

Gregor Harvie argues that AI is state-sanctioned theft of IP.

Many resources for visitors aswell as new features for members.
Using technology to empower communities

The Community data platform; capturing the DNA of a place and fostering participation, for better design.
Heat pump and wind turbine sound calculations for PDRs
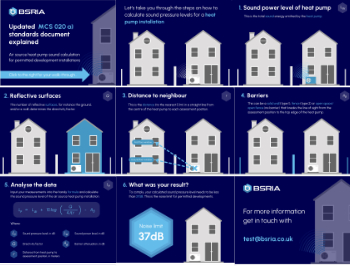
MCS publish updated sound calculation standards for permitted development installations.
Homes England creates largest housing-led site in the North
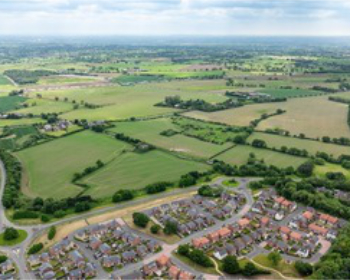
Successful, 34 hectare land acquisition with the residential allocation now completed.
Scottish apprenticeship training proposals

General support although better accountability and transparency is sought.
The history of building regulations

A story of belated action in response to crisis.
Moisture, fire safety and emerging trends in living walls

How wet is your wall?

Current policy explained and newly published consultation by the UK and Welsh Governments.
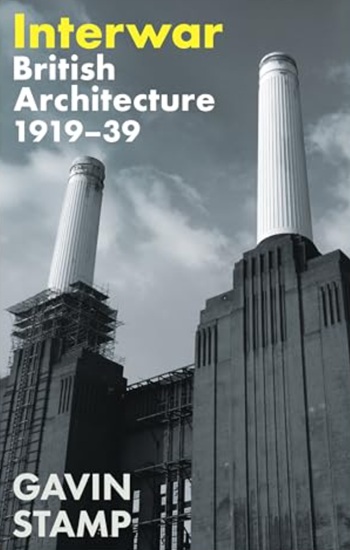
British architecture 1919–39. Book review.
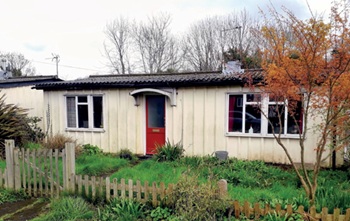
Conservation of listed prefabs in Moseley.
Energy industry calls for urgent reform.

Heritage staff wellbeing at work survey.

A five minute introduction.
50th Golden anniversary ECA Edmundson apprentice award
![]()
Showcasing the very best electrotechnical and engineering services for half a century.
Welsh government consults on HRBs and reg changes
Seeking feedback on a new regulatory regime and a broad range of issues.
CIOB Client Guide (2nd edition) March 2025

Free download covering statutory dutyholder roles under the Building Safety Act and much more.
Comments
Who is the author of this article? I cant find the name.
Designing Buildings Wiki is a wiki site – articles are developed over a period of time by our users. As such, there is no specific author. To reference an article on the site, just reference Designing Buildings Wiki as the publisher, and the date that you accessed it.