


Quality tools: fishbone diagram
Contents |
[edit] What is it?
Created by Kaoru Ishikawa in the 1960s, the Fishbone diagram (cause and effect diagram) is a visual tool that shows the potential relationship between a topic (output – effect) and the various factors (inputs – causes) related to it. The diagram resembles the skeleton of a fish as the main causal categories are drawn as ‘bones’ attached to the spine of the fish.

[edit] When and how can I use it?
This tool encourages team participation and is useful in brainstorming. It can be used any time when the cause of a problem is unknown, such as a product defect or issues in the manufacturing or management process. The problem statement and potential categories of causes allow multiple categories of causes to be explored. It can be used as a planning tool to assure that all inputs necessary for a desired outcome have been identified. It can also be used to consider what went right and why during a ‘lessons learned’ exercise at the end of a project.
[edit] Steps
To show the relationships between the cause and effect, and to form a hierarchy of events, the potential causes are arranged based on their level of detail. These are the typical main categories: materials, equipment, people, environment, methods (MEPEM) and sometimes measurement. Facilities, technologies, policies, and practices could be other categories to consider.
1 On the far right side of the diagram write the problem statement. This may be the actual problem or it may be a symptom – at this point you’re not exactly sure and the effect may be refined as more information emerges.
2 Draw a long horizontal arrow pointing to the box. This arrow will serve as the backbone from which further major and minor causes will be categorised and related.
3 Identify potential causes and group them into major categories along the ‘bones’ of the fishbone diagram. Major categories can be established using brainstorming. At this point you shouldn’t be concerned if there is disagreement about whether a category holds the potential cause or not. Just include all of them. Make sure to leave enough space between the major categories on the diagram so that you can add the minor detailed causes.
4 Once you and your team have listed all possible causes you then have the information needed to identify and agree the most likely causes and decide which to investigate further.
[edit] Did you know?
The Fishbone diagram is one of the seven basic quality tools. The Project Management Institute references these seven tools in A Guide to the Project Management Body of Knowledge as an example of a set of general tools useful for planning or controlling project quality.
This article was produced by Jo Dovey and Brian Rutter on behalf of the Chartered Quality Institute and published in Quality World, January 2019.
--ConSIG CWG 18:24, 26 May 2019 (BST)
[edit] Related articles on Designing Buildings Wiki
Featured articles and news
ECA Blueprint for Electrification

The 'mosaic of interconnected challenges' and how to deliver the UK’s Transition to Clean Power.
Grenfell Tower Principal Contractor Award notice
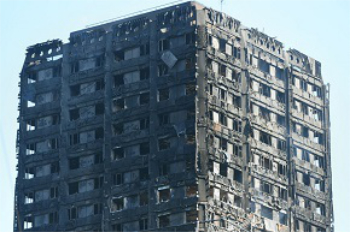
Tower repair and maintenance contractor announced as demolition contractor.
Passivhaus social homes benefit from heat pump service

Sixteen new homes designed and built to achieve Passivhaus constructed in Dumfries & Galloway.
CABE Publishes Results of 2025 Building Control Survey

Concern over lack of understanding of how roles have changed since the introduction of the BSA 2022.
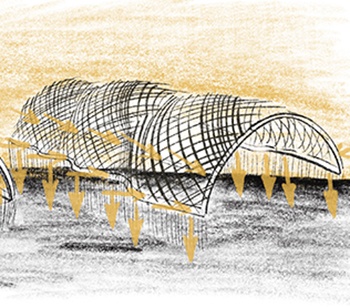
British Architectural Sculpture 1851-1951

A rich heritage of decorative and figurative sculpture. Book review.

A programme to tackle the lack of diversity.
Independent Building Control review panel
![]()
Five members of the newly established, Grenfell Tower Inquiry recommended, panel appointed.
Welsh Recharging Electrical Skills Charter progresses

ECA progressing on the ‘asks’ of the Recharging Electrical Skills Charter at the Senedd in Wales.
A brief history from 1890s to 2020s.
CIOB and CORBON combine forces

To elevate professional standards in Nigeria’s construction industry.
Amendment to the GB Energy Bill welcomed by ECA

Move prevents nationally-owned energy company from investing in solar panels produced by modern slavery.
Gregor Harvie argues that AI is state-sanctioned theft of IP.

Heat pumps, vehicle chargers and heating appliances must be sold with smart functionality.
Experimental AI housing target help for councils

Experimental AI could help councils meet housing targets by digitising records.
New-style degrees set for reformed ARB accreditation
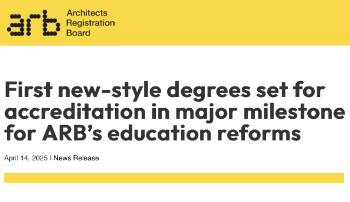
Following the ARB Tomorrow's Architects competency outcomes for Architects.
BSRIA Occupant Wellbeing survey BOW
Occupant satisfaction and wellbeing tool inc. physical environment, indoor facilities, functionality and accessibility.