Wind energy
Contents |
[edit] Introduction
The scientific community has warned that there is an urgent need for a transition to a low carbon economy if we are to avert a global catastrophe due to climate change.
The concentration of CO2 in the atmosphere reached 400 ppm in 2014, up from 280 ppm in pre-industrial times, corresponding to 375,000,000,000 tonnes of CO2 released into the atmosphere since 1750.
Wind is a clean, plentiful renewable energy source.
The UK has relatively good and easily exploited wind resources:
- It has 40% of Europe’s wind due to its position in the North West of Europe where it bears the full brunt of weather systems coming in from the North Atlantic.
- It has the longest coastline in Europe (the island of Great Britain has a coastline of 17,820 km according to the Ordnance Survey).
- It has many shallow waters, ideal for off-shore wind.
- It has many sparsely populated upland areas, mainly in the North which is also the region with the most significant wind resources.
Wind is the most developed renewable energy source in the UK.
[edit] Wind installations in the UK
The first British wind farm was established in 1991 at Delabole, Cornwall. Since then, largely due to the government's Renewables Obligation, UK wind energy capacity has flourished and is now considered one of the best locations in the world. In 2012, the UK was the world leader in offshore wind.
As of August 2018, there were 8,930 wind turbines with a total installed capacity of over 19.2 GW (12,121 MW of which were onshore, and 7,155 MW of which were offshore).
In 2017, wind power contributed 15% of the UK's electricity generation.
In February 2017, it was reported that the construction value of offshore wind reached £4.1 billion in 2016, increasing from £2.45 billion in 2015.
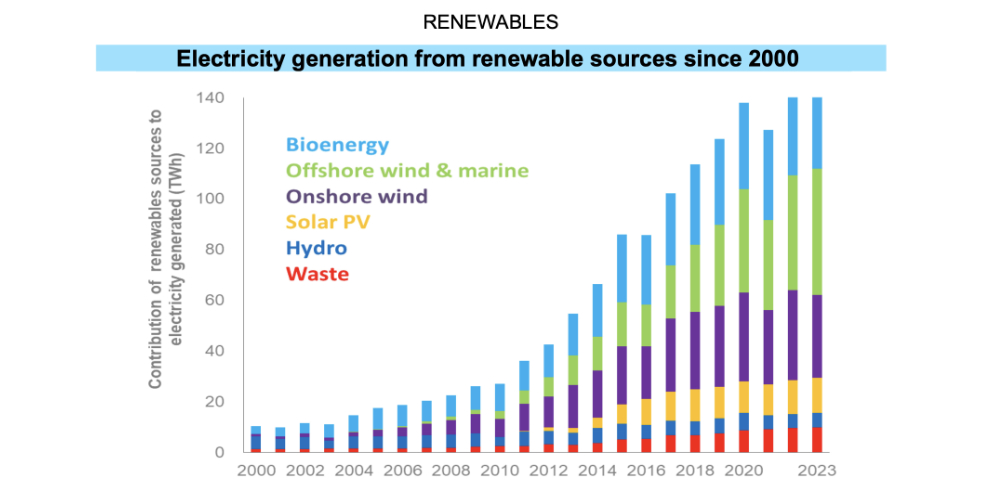
By 2023, Wind power contributed 29.4%of the UK's total electricity generation, for around 10 days in December only it can contribute to more than 50% of Great Britain's electricity generation comes from wind. (BBC Record year for wind power in 2024). As part opf the overall renewables contribution, on and off shore wind power continue to contribute the highest amounts to the electrocioty grid, with a year on year growth.
Source: Electricity capacity, 1996 to 2023 UK ENERGY IN BRIEF 2024
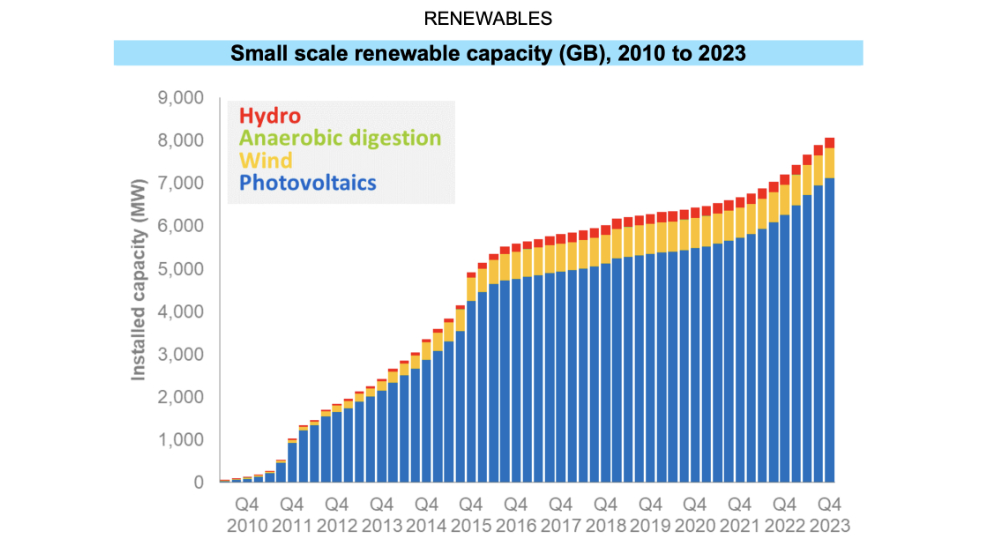
However when looking at small scale installations or microgeneration schemes, solar far out weighs wind power, although both have increased year on year.
Source: Small scale renewable capacity (GB), 2010 to 2023, 1996 to 2023 UK ENERGY IN BRIEF 2024
[edit] Public perception of wind power
There are some vocal opposition groups to wind power who object to new wind farms being built in their area, claiming that they are noisy, a danger to wildlife and a blight on the countryside.
However, by and large, the British view wind power in a favourable light. In surveys carried out in 2012 for RenewablesUK, the body which champions UK wind and marine energy, and for the Sunday Times, it emerged that:
- 77% of Britons are in favour of electricity from renewables.
- 73% of Britons support offshore wind and 66% onshore wind installations.
- Only 17% of Britons support additional gas/coal power stations.
- Only 40% of Britons support additional nuclear power stations.
By the Spring of 2024, it was reported that 84% of people said they supported the use of renewable energy such as wind power, solar energy and biomass to provide electricity, fuel and heat, which was an increase from 82% in winter 2023, but remained below a peak perception in the autumn 2022 peak (88%). Overall opposition to renewables has remained stable over time at just 2%, with strong supporters also peaking to 56% in Autumn 2022 but remaining in general around 49% from Winter 2023 onwards.
[edit] Advantages and disadvantages of wind power
[edit] Advantages
- The main advantage is the low carbon nature of wind power. It is a completely 'clean' energy, other than the manufacture and construct on of the pylons, blades and turbines.
- Wind power generation is relatively silent.
- The wind is strongest in the winter months when energy demand is at its highest.
- Many jobs are created in designing, manufacturing, and servicing the equipment.
Analysis from the Carbon Trust suggests offshore wind has the potential to deliver significant benefits to the UK, including:
- A 7% reduction in UK carbon emissions versus 1990
- A quarter of a million UK jobs by 2050
- Annual revenues of some £19 billion by 2050
[edit] Disadvantages
- The main disadvantage is the unpredictable nature of wind speeds resulting in turbines being immobile for significant periods.
- It is difficult to store generated power.
- Wind turbines tend to be large and very visible within the countryside.
[edit] International comparisons
[edit] Worldwide
There was 250 GW installed capacity worldwide in 2012. The UK ranks 8th in the world for installed capacity, however on a per-capita basis the UK is not in the top 20.
The 8 countries with the most installed capacity are (2011 figures, GW):
- China (62.4)
- USA (46.9)
- Germany (29.1)
- Spain (21.7)
- India (15.9)
- Italy (6.7)
- France (6.6)
- United Kingdom (6.5)
[edit] Europe
The UK had the 5th largest installed capacity in Europe at the end of 2011; this reflects its fairly late uptake of wind power compared for example with Germany, which has by far the most capacity, or Spain.
Installed capacity in Europe, end of 2011 (MW)
| Ger | Spain | France | Italy | UK | Port | Den | Swe | NL |
| 29,060 | 21,674 | 6,800 | 6,747 | 6,540 | 4,083 | 3,871 | 2,907 | 2,328 |
Germany had the largest new installed capacity in Europe in 2011 (2,100 MW) with the UK following at 1,300 MW, of which 752 MW was offshore wind. Spain came third (1,050 MW) and then France (830 MW).
NB: RenewableUK claim that a new UK record was achieved for wind energy on 17 August 2014, when 22% of the UK’s electricity was generated by wind, an average of 5,797 MW.
[edit] Policy
In March 2019, Energy and Clean Growth Minister Claire Perry announced the launch of a new joint government-industry Offshore Wind Sector Deal intended to supply a third of all UK electricity by 2030. Ref https://www.gov.uk/government/news/offshore-wind-energy-revolution-to-provide-a-third-of-all-uk-electricity-by-2030
In 2024 in their policy statement on onshore wind from 8 July, 2025 shortly after winning the general election, the Labour government "committed to doubling onshore wind energy by 2030. That means immediately removing the de facto ban on onshore wind in England, in place since 2015. We are revising planning policy to place onshore wind on the same footing as other energy development in the National Planning Policy Framework (NPPF)." Further more it said "Currently, planning policy includes two tests, set out in footnotes 57 and 58 to paragraph 163 of the NPPF, that apply only to onshore wind. Together they say that development can only be considered acceptable:
- a. In areas either allocated in a development plan or through Local Development Orders, Neighbourhood Development Orders and Community Right to Build Orders. This sets a higher bar than is set for other forms of development.
- b. With the narrow exception of proposals brought forward by Neighbourhood Development Orders and Community Right to Build Orders, where the proposal has proved community support. In practice this has often been interpreted to mean that any opposition means the proposal cannot be considered acceptable."
and that "These policy tests no longer apply. The removal of these tests from planning policy means that onshore wind applications will be treated in the same way as other energy development proposals." The changes took effect 8 July 2024. The government will confirm this position to Parliament on 18 July, following the State Opening. These changes will also be reflected in the forthcoming NPPF update.
Policy statement on onshore wind
Published 8 July 2024
[edit] Related articles on Designing Buildings
- Carbon capture and storage.
- Energy Act.
- Energy storage.
- Geothermal pile foundations.
- Ground energy options.
- Large scale solar thermal energy.
- Nimbyism.
- Renewable energy.
- Rainwater harvesting.
- Sustainability.
- Solar photovoltaics.
- Solar thermal energy.
- The future of UK power generation.
- Why the UK needs to support emerging tech like energy storage.
- Wind farm.
- Wind turbine.
- Windcatcher.
- World leaders urged to embrace wind energy.
[edit] External references
- www.decc.gov.uk Department of Energy and Climate Change
- http://www.ewea.org European Wind Energy Association
- Carbon Trust Offshore Wind Accelerator
- http://www.wmo.int World Meteorological Organization.
Featured articles and news
Building Safety recap January, 2026
What we missed at the end of last year, and at the start of this...
National Apprenticeship Week 2026, 9-15 Feb
Shining a light on the positive impacts for businesses, their apprentices and the wider economy alike.
Applications and benefits of acoustic flooring
From commercial to retail.
From solid to sprung and ribbed to raised.
Strengthening industry collaboration in Hong Kong
Hong Kong Institute of Construction and The Chartered Institute of Building sign Memorandum of Understanding.
A detailed description fron the experts at Cornish Lime.
IHBC planning for growth with corporate plan development
Grow with the Institute by volunteering and CP25 consultation.
Connecting ambition and action for designers and specifiers.
Electrical skills gap deepens as apprenticeship starts fall despite surging demand says ECA.
Built environment bodies deepen joint action on EDI
B.E.Inclusive initiative agree next phase of joint equity, diversity and inclusion (EDI) action plan.
Recognising culture as key to sustainable economic growth
Creative UK Provocation paper: Culture as Growth Infrastructure.
Futurebuild and UK Construction Week London Unite
Creating the UK’s Built Environment Super Event and over 25 other key partnerships.
Welsh and Scottish 2026 elections
Manifestos for the built environment for upcoming same May day elections.
Advancing BIM education with a competency framework
“We don’t need people who can just draw in 3D. We need people who can think in data.”
Guidance notes to prepare for April ERA changes
From the Electrical Contractors' Association Employee Relations team.
Significant changes to be seen from the new ERA in 2026 and 2027, starting on 6 April 2026.
First aid in the modern workplace with St John Ambulance.
Solar panels, pitched roofs and risk of fire spread
60% increase in solar panel fires prompts tests and installation warnings.
Modernising heat networks with Heat interface unit
Why HIUs hold the key to efficiency upgrades.


Comments
The main figures in the body of this article are in urgent need of updating!
So update it. This is a wiki site, written by its users.