Eutrophication potential
Contents |
[edit] Introduction
Eutrophication (from Greek ‘eutrophos’ meaning ‘well nourished’ and pronounced ‘you-tro-fi-kay-shun’) is the process by which aquatic environments (rivers, lakes, coastal estuaries and shallow sea areas) become excessively enriched by minerals and nutrients which induce excessive growth of plants and animal life. This enrichment will be harmful if it leads to the death of plant and animal life and can occur in two ways:
- Cultural eutrophication.
- Natural eutrophication.
[edit] Natural eutrophication
Natural eutrophication is part of the ageing process of freshwater ecosystems and is a common phenomenon, particularly in lakes. Scientists recognise that a lake’s natural productivity may be regulated by factors such as climate change, geology and other external factors.
The fertility of such freshwater bodies changes over time if they are fed rich nutrients by a stream or river, leading to abundant plant or animal life; the lake or pond is then classed as ‘eutrophic’. However, if excessive it could adversely affect aquatic life. Although the process is extremely slow and occurs over millennia, it can be speeded up by cultural eutrophication.
[edit] Cultural eutrophication
Cultural eutrophication occurs primarily as a result of human activity (industrial, domestic and agricultural) when nutrients, such as fertilizer chemicals (nitrates and phosphates), detergents and nutrients from municipal sewage, are conveyed into a water body by rainwater run-off. This causes higher rates of algal and bacterial growth. As the algal bloom decomposes and dies, it consumes oxygen which reduces concentration in the water and may lead to the extinction of fish and other life. Once it sinks to the bottom, bacteria begin to decompose the algal remains, using oxygen in the process. Eventually, as levels of nutrients rise to an unacceptable level, the water body can sustain no life, fish suffocate and plants die.
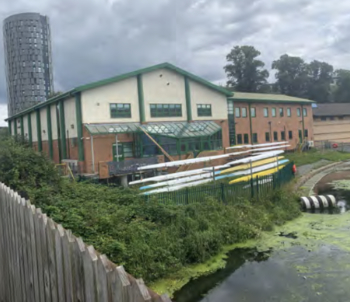
Eutrophication is often characterised by the bright green algal bloom floating on the surface. If this is in sufficient quantities, it may block sunlight from penetrating to the bottom of the water body, thereby depriving plants of the ability to photosynthesise.
NB Water for life and livelihoods, River basin management plans, Glossary, Published by the Environment Agency in 2016, defines eutrophication as: ‘The enrichment of waters by nutrients, especially compounds of nitrogen and/or phosphorus, causing an accelerated growth of algae and higher forms of plant life, producing an undesirable disturbance to the balance of organisms present in the water and the quality of the water concerned.’
[edit] Eutrophication potential (EP)
Eutrophication potential (EP) is defined as the potential to cause over-fertilisation of water and soil, which can result in increased growth of biomass. The overabundance of algae and plants caused by eutrophication sets off a chain reaction in the ecosystem, the excess algae and plant matter eventually decompose, producing large amounts of carbon dioxide. This lowers the pH of seawater, a process known as ocean acidification, which would have negative overall effects on many marine species, altering marine food chains and food supply to humans.
[edit] EN 15804:2012+A2:2019/AC:2021
Eutrophication potential is one of the core environmental impact indicators of EN 15804:2012+A2:2019/AC:2021which is used as guidance in the generation of the life cycle assessment (LCA) methodology used to create Product Environmental Footprints (PEF). It is also one of the mandatory environmental performance indicators for the calculation, assessment and generation of environmental product declarations (EPDs).
Three different environmental protection indicators or areas are defined as: Aquatic freshwater, Aquatic marine, and terrestrial, accumulated exceedance (EN 15804. Version: August 2021). Each area has a different set of measures and indicators outlined below:
[edit] Aquatic freshwater levels
In the same way that the global warming potential (GWP) of different pollutants are converted to ratios CO2 equivalent figures, aquatic freshwater emissions are converted to P eq (phosporus) as below:
1 kg phosphorus = 1 kg P eq.
1 kg phosphate = 0.33 kg P eq.
1 kg phosporic acid = 0.32 kg P eq.
(Refs, EUTREND model, EN 15804. Version: August 2021, Struijs et al. 2009 as implemented in ReCiPe)
[edit] Aquatic marine water levels
Aquatic marine water emissions are converted to N eq (Nitrogen) as below:
1 kg nitrogen oxides = 0.389 kg N eq.
1 kg ammonia = 0.092 kg N eq.
(Refs, EUTREND model EN 15804. Version: August 2021, Struijs et al. 2009 as implemented in ReCiPe)
[edit] Terrestrial waters levels
Terrestrial water emissions are converted to N eq (Nitrogen) as below:
1 kg nitrogen oxides = 4.26 mol N eq.
1 kg nitrate = 3.16065 mol N eq.
1 kg ammonia = 13.47 kg N eq.
(Refs, accumulated exceedance, EN 15804. Version: August 2021, Seppälä et al. 2006, Posch et al. 2008)
[edit] Baseline levels
Finally a baseline reference is given below:
Version 1.0 of the default list of indicators (valid until 2022-12-31)
(Refs, EP, CML 2001 baseline (fate not included), Version: January 2016, Heijungs et al. (1992)
Examples
1 kg phosphate = 1 kg PO43- eq.
1 kg ammonia = 0.35 kg kg PO43- eq.
1 kg COD (to freshwater) = 0.022 kg kg PO43- eq.
[edit] Related articles on Designing Buildings
- Acidification potential EP.
- Ecologist.
- Ecology compensation.
- Ecology connectivity.
- Green Guide to Specification.
- Habitat Suitability Index.
- Material procurement.
- Product carbon footprint (PCF).
- Product Category Rules.
- Product Environmental Footprint PEF
- Responsible sourcing of construction products.
- Sustainable materials for construction
- Water consumption.
- Water resources.
- Water.
- Types of water
Featured articles and news
Repairing historic stone and slate roofs
The need for a code of practice and technical advice note.
UKCW London to tackle sector’s most pressing issues
AI and skills development, ecology and the environment, policy and planning and more.
Managing building safety risks
Across an existing residential portfolio; a client's perspective.
ECA support for Gate Safe’s Safe School Gates Campaign.
Core construction skills explained
Preparing for a career in construction.
Retrofitting for resilience with the Leicester Resilience Hub
Community-serving facilities, enhanced as support and essential services for climate-related disruptions.
Some of the articles relating to water, here to browse. Any missing?
Recognisable Gothic characters, designed to dramatically spout water away from buildings.
A case study and a warning to would-be developers
Creating four dwellings... after half a century of doing this job, why, oh why, is it so difficult?
Reform of the fire engineering profession
Fire Engineers Advisory Panel: Authoritative Statement, reactions and next steps.
Restoration and renewal of the Palace of Westminster
A complex project of cultural significance from full decant to EMI, opportunities and a potential a way forward.
Apprenticeships and the responsibility we share
Perspectives from the CIOB President as National Apprentice Week comes to a close.
The first line of defence against rain, wind and snow.
Building Safety recap January, 2026
What we missed at the end of last year, and at the start of this.


