Process and flowcharting; mapping approaches for standardisation
Contents |
[edit] Introduction
Process flowcharting is usually considered as one of the 7 classic tools of quality, together with Pareto charts, cause-and-effect diagrams, control charts, check sheets, scatter diagrams, and histograms. Flowcharts are used to visualise the steps involved in a process. This method helps organisations understand, analyse, and improve their workflows. By standardising these processes, businesses can ensure consistency, efficiency, and quality across their operations.
Flowcharts can also be used to show the interfaces between departments/teams internally, and external stakeholders involved in/party to the process.
As well, they can also refer to a drop down sub process where more detail of a specific activity, eg a work instruction is needed for control.
[edit] What is a Process?
A process is an activity or group of activities starting with an input, adding value to it, and arriving to an output for a customer. It can be a planned and repetitive sequence of steps to provide a service or a product.
[edit] What is a Flowchart and is it different from a process map?
A flowchart is a map to show the sequence of steps and decision points that exist in a process.
The reference to “a map” causes confusion in the terminology. Commonly, process flowchart and process mapping are used interchangeably and, for this article, they will be used as synonyms. However, a process map is a more comprehensive representation of a process as it is not limited to steps, but includes inputs, outputs, roles and timelines.
So, process flowcharts and process maps differ for:
- The level of detail – a process map is a more comprehensive representation of a process as it is not limited to steps, but includes inputs, outputs, roles and timelines.
- Scope – flowchart better suits simple processes, while more complex ones may benefit from a process map
- Purpose – flowcharts can summarise a process to simplify its communication to the team and enhancing the understanding of what the work is about. Process maps, having higher level of details, can support analysis and improvement more than immediate application.
[edit] When to use a Flowchart?
A flowchart is quite versatile as it can be used to:
A flowchart can show actions, materials or services, reminding when a decision needs to be made and what options come from that. It can be adapted to virtually any process in any industry and can exist as a stand-alone document or to clarify the content of a procedure or work instruction.
What types of flowcharts exist?
The term flowchart encompasses a variety of charts. Some of them align with the scope of this article: macro- flowchart and top-down flowcharts. The others are mentioned here for completeness of information but are more complex and would require a longer and more detailed description on how to produce them.
The main flowcharts are:
It shows the major steps of the process. It can be used as a starting point to show the bigger picture, before details are added. An example is the main steps to fill in an order.
Figure 1 – Example of Macro Flowchart to describe how to fill in an order
- Top-down flowchart
The focus is on major steps and the first level below them. The purpose is mainly clarity: not too many details but still enough to have a better understanding.
Figure 2 – Example of Top-down Flowchart to describe how to prepare an offer
- Detailed flowchart
This is the above mention process map: deep into details. It can contain major and minor activities, decisions, delays, and elements showing how the process is done.The production of a detailed flowchart is obviously longer and more articulated than the previous ones.
- Deployment flowchart
As the detailed flowchart, this is also a more complete chart that shows who performs what, who is assigned to each step.
- Several-levelled flowchart
It is a combination of macro and detailed flowcharts, showing different levels of detail of the same process.
[edit] What are the benefits of flowcharts?
Flowcharts offer numerous benefits for visualising and improving processes. A picture paints a thousand words is very true, especially nowadays when readers attention span to text is generally quite short. Here are some key advantages:
- Clarity and Simplification: used as stand-alone documents or as part of complex procedures, flowcharts break down complex processes into individual steps, making them easier to understand and follow. The logic of a process becomes clear to see.
- Improved Communication: the visual representation done in a flowchart can be easily shared and understood by all team members, enhancing communication and collaboration. It makes it unambiguous
- Identification of Bottlenecks: it can be hard to identify where delays happen in a process. By mapping out the entire process, flowcharts help identify inefficiencies and bottlenecks, allowing for targeted improvements.
- Standardisation: diagrams are less prone than words to interpretation. A flowchart guarantees that processes are performed consistently, supporting quality and reliability.
- Training and Onboarding: flowcharts can contain the main info to get proper understanding of how a process works, without the need to read long documents. So, visual aids can help new employees to quickly grasp processes, speeding up the training and onboarding.
- Documentation: they serve as a record of processes for future reference and audits.
- Problem-Solving: flowcharts help in diagnosing problems by visually tracing the steps where issues may arise.
- Efficiency: flowcharts can streamline processes by highlighting redundant or unnecessary steps, leading to increased efficiency.
[edit] How to make a flowchart?
The production of flowcharts still benefits from the old fashion “pen and paper” approach. Starting directly with PowerPoint or other software can be an obstacle: first the ideas need to be clear about the target to be achieved and the process to be charted.
These six steps support a good result:
- Write the process to be charted and define the borders of it. The boundary between two processes may overlap so it is critical to define since the start where the limits are. It is not essential that the decision is accurate, as the use of the flowchart will help correcting initial poor decision.
- Clarify the level of detail to be achieved. As shown before, there can be very detailed flowcharts but the deeper the analysis, the longer the time both to produce it and to agree with all the involved stakeholders.
- Use brainstorming to identify all the activities involved. It is a good exercise to verify the correctness and completeness of the procedures or guidelines in place to describe the process.
- Define the correct sequence of the activities.
- Start connecting the activities with arrows to show how the process flows.
- Achieve agreement with all the stakeholders.
The above works better with post-it notes, using one for each step, so that everyone has a clear picture of the activities and can easily relocate any, if needed.
It is for you to decide if you prefer a dogmatic approach by creating the flowchart “the right way” or not, with the standardised symbols. Ideally, because it has to work in your organisation, up to when it is clear to everyone, the correct use of symbols or other elements of the flowchart is of minor importance. After all, flowcharts are a tool: if it reaches the purpose, job done.
The reference to stakeholders is in the wider sense. Depending on the process, it can be useful to involve suppliers, clients and everyone working on the process.
Those who perform the process are the best qualified to draw the flowchart, even if they have never done one before. They hold the knowledge: the rest is merely a graphical representation that can be improved at a later stage, before releasing the flowchart.
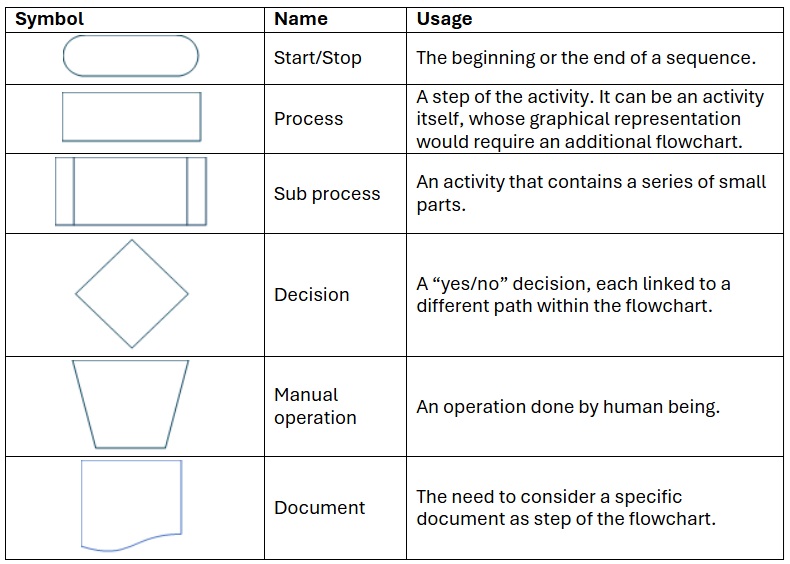
The complexity of the process and the number of people involved may dictate how many sessions are needed to complete the task. There is not a right number of meetings. Eventually, there is a right way to conduct them: ensure that everyone participate and have clear the purpose of the meeting, with direct access to all the information.The symbols to be used are available in all main software like PowerPoint. Here below a short selection of symbols, sufficient to satisfy the basic needs.
Figure 3 – Main symbols to satisfy basic needs
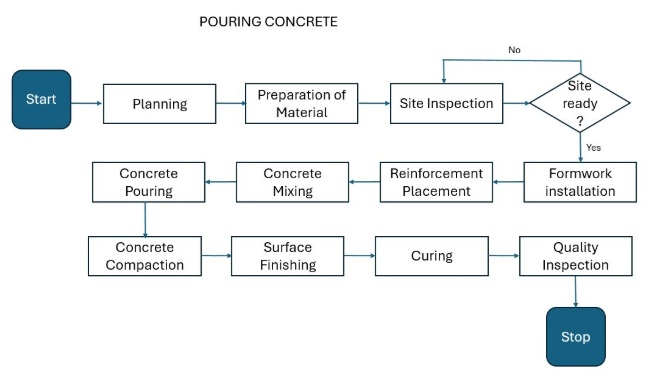
Figure 4 – An example of flowchart for pouring concrete
Figure 5 & 6 – An example of flowchart for construction management
[edit] Conclusions
Flowcharts are a scalable tool that serves clarity and support improvement. There are various types of flowcharts, mainly linked to a specific level of detail. The lack of experience in producing a flowchart is not a limit: they are tools within everyone’s reach, regardless of their background. What is critical is taking the right steps to obtain a good result: defining the process, involving stakeholders, and fostering collaboration.
Flowcharts are such a powerful tool that they can be used on the go to explain a concept described in pages of procedures. The adherence to the coded symbols is not essential if the message is understood by the involved parties.
Original article written by Giorgio Mannelli, reviewed by Graham Taylor on behalf of the CQI Construction Special Interest Group (ConSIG), and accepted for publication by the Thought/Knowledge Working Group on 25/11/2024.
Featured articles and news
Amendment to the GB Energy Bill welcomed by ECA
Move prevents nationally-owned energy company from investing in solar panels produced by modern slavery.
Gregor Harvie argues that AI is state-sanctioned theft of IP.
Heat pumps, vehicle chargers and heating appliances must be sold with smart functionality.
Experimental AI housing target help for councils
Experimental AI could help councils meet housing targets by digitising records.
New-style degrees set for reformed ARB accreditation
Following the ARB Tomorrow's Architects competency outcomes for Architects.
BSRIA Occupant Wellbeing survey BOW
Occupant satisfaction and wellbeing tool inc. physical environment, indoor facilities, functionality and accessibility.
Preserving, waterproofing and decorating buildings.
Many resources for visitors aswell as new features for members.
Using technology to empower communities
The Community data platform; capturing the DNA of a place and fostering participation, for better design.
Heat pump and wind turbine sound calculations for PDRs
MCS publish updated sound calculation standards for permitted development installations.
Homes England creates largest housing-led site in the North
Successful, 34 hectare land acquisition with the residential allocation now completed.
Scottish apprenticeship training proposals
General support although better accountability and transparency is sought.
The history of building regulations
A story of belated action in response to crisis.
Moisture, fire safety and emerging trends in living walls
How wet is your wall?
Current policy explained and newly published consultation by the UK and Welsh Governments.
British architecture 1919–39. Book review.
Conservation of listed prefabs in Moseley.
Energy industry calls for urgent reform.


