


Breaking Down The Construction Industry - Infographic
Note: It is not clear what the figures for industry revenue and output in this infographic refer to. Construction industry annual output is actually in the order of £100bn, depending the exact measure and index year. See Office for National Statistics for more information.
We have created an infographic showing various statistics within the British construction industry including revenue, employment and business statistics, health and safety statistics and many more. This is a good infographic to read if you are considering a career within the construction industry. The information shown below has been taken from a variety of different sources including the HSE, OBAS, Ibis World and the UK government.
See more Construction industry infographics.

Featured articles and news

From Chaucer to Fawlty Towers.

Electrotechnical excellence, now open for entries.
Net zero electricity grids BSRIA guide NZG 5/2024
Outlining the changes needed to transition to net zero.
CIOB Global Student Challenge 2024

Universitas Indonesia wins for second year running.

New project and cultural district described in detail.
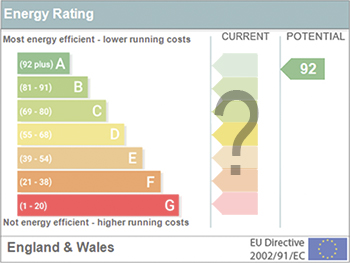
The nature of EPCs, crticism and inaccuracies.

History, issues and redesign.
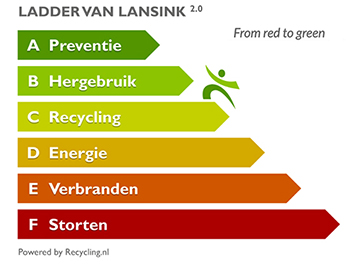
From waste recycling to energy performance the hierchy.
An introduction to WERCS and WEEE responsibilities

Dealing with 2 million tonnes of waste equipment a year.
Global BACS Market: analytics and optimisation

A BSRIA glance at building automation and control systems.

What it is and how to use it.

Types of insulating plaster by binder and insulant.
Investors in People: CIOB achieves gold

Reflecting a commitment to employees and members.

Scratching beneath the surface; a guide to selection.
ECA 2024 Apprentice of the Year Award

Entries open for submission until May 31.
UK gov apprenticeship funding from April 2024
Brief summary the policy paper updated in March.